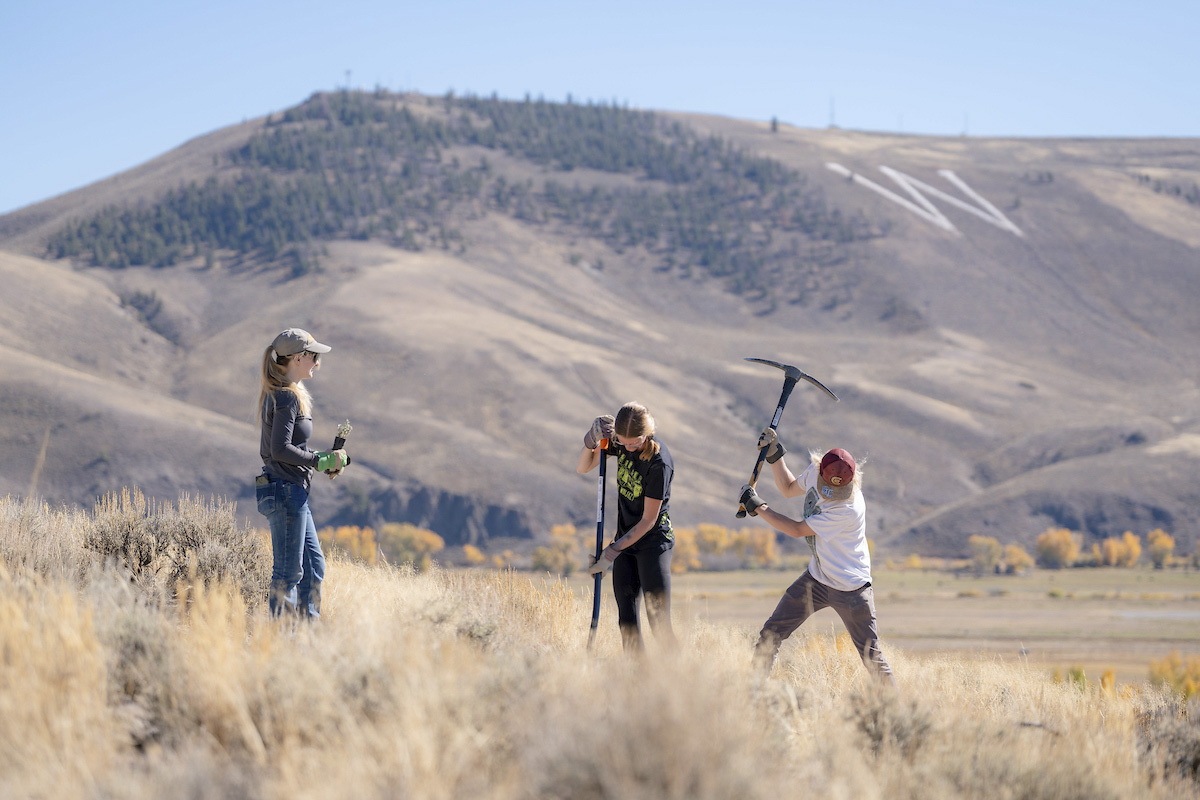
Located in the heart of the Rocky Mountains, Western Colorado University delivers career preparation, engineering, computer and other sciences and a liberal arts curriculum to 2,900 intellectually adventurous students. Here, students can explore their field of study, gain leadership experience and discover extraordinary adventure in western Colorado.
Our Mission
Dedicated to education, enriched by our community.
Western Colorado University promotes intellectual maturity and personal growth in its students and prepares them to assume constructive roles in local, national and global communities. Western’s distinctive character emerges from its unity among academic and professional disciplines, high standards of scholarship, and a unique environment in the mountains of western Colorado.
Discover tomorrow’s leaders
Western programs combine academic rigor with personal development, so students have the skills to succeed as professionals in their field of study.
Setting the stage for success
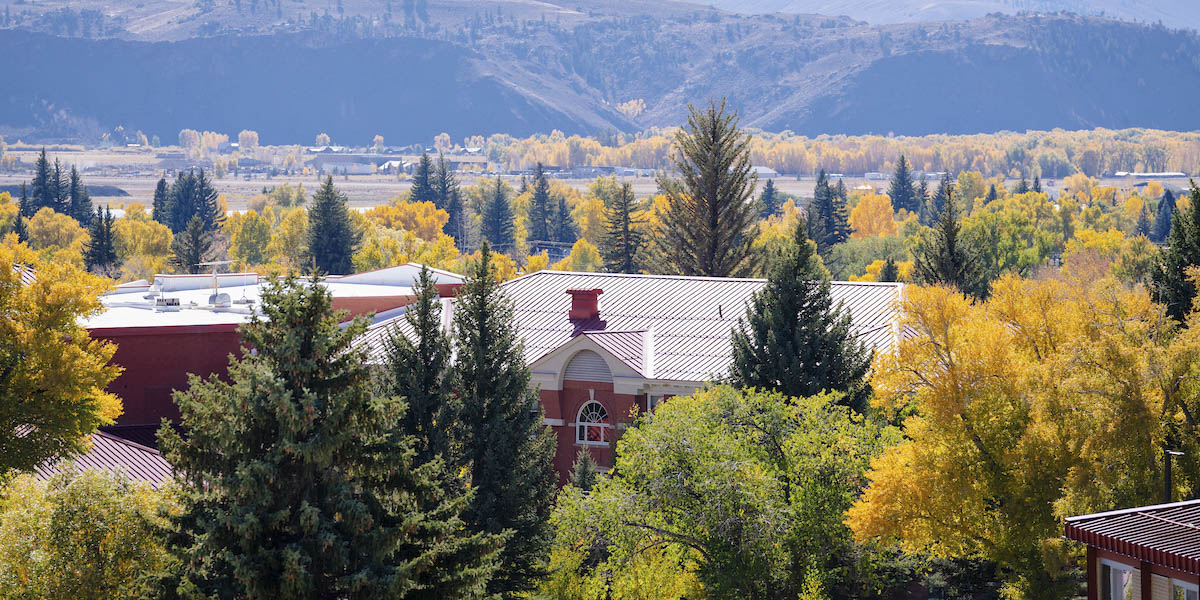
Western’s location in Gunnison, Colorado provides an excellent academic experience in a gorgeous setting.
Facts & Figures
Western’s size and setting promotes exceptional educational experiences.
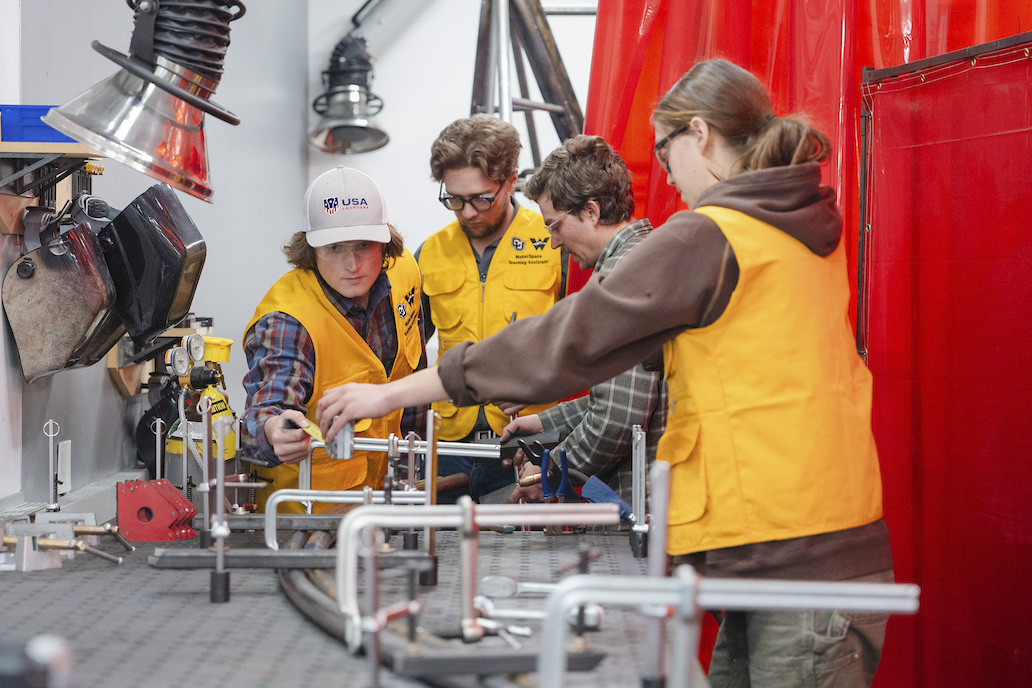
Our university’s small size and unique setting ensures students receive personalized attention, gain hands-on experience and become better leaders. We are proud to serve our state and country by preparing our students to make meaningful contributions in Colorado and beyond. From cybersecurity experts to social workers and teachers, Western graduates become preeminent leaders in their fields.
The following statistics reflect the most recent stable data compiled by the institution encompassing retention, graduation rates, institutional research, common data sets, student outcomes, and student achievements. For more information, visit Western’s profile on the National Center for Education Statistics website.
Annual ReportEstablished: 1901
Location: Gunnison, Colorado
Type: Public, 4-year
Religious affiliation: None
Highest degree offered: Master’s
Student-to-faculty ratio: 18 to 1
Mascot: Mad Jack the Mountaineer
Colors: Crimson and slate
Graduation rate: 51%
Applicants admitted: 84%
Students considered for aid: 100%
Students who receive aid: 80%
Total enrollment: 3,418
Undergraduate: 3,015
Graduate: 403
Male: 51%
Female: 49%
In-state: 76%
Out-of-state: 24%
White: 59%
Hispanic: 16%
Black or African American: 4%
Multi-Race: 2%
Asian: <1%
American Indian or Alaska Native: <1%
Native Hawaiian or other Pacific Islander: <1%
Unknown/Other: approx. 20%
The Office of Institutional Research performs statistical and analytical studies that support the academic, co-curricular and administrative functions of the University, including compilation and interpretation of information for enrollment analysis, student tracking, assessment, planning, budgeting and evaluation. The Institutional Research office generates and interprets data for individual campus departments, student projects, the Colorado Department of Higher Education and federal offices. Institutional Research personnel develop surveys of alumni, faculty, staff and students to further understanding of perceptions and emerging trends among University constituents.
INSTITUTIONAL AND STUDENT OUTCOME DATA
Post Graduation NACE Career Placement Data:
2020-2021
- Response rate: 49.7%
- Achieved outcome (working): 73.5%
- Avg salary: $40,470 (bachelor’s only)
2019-2020
- Response rate: 26.4%
- Achieved outcome (working): 73.3%
- Avg salary: $40,573 (bachelor’s only)
Download the Institutional Data Set containing the following:
- Enrollment
Enrollment (All student levels)Resident FTE-S Non-resident FTE-S Cash Funded FTE-S Total FTE-S Fall Headcount 2016-17 1630.28 566.12 157.88 2354.28 2921 2017-18 1528.18 590.89 149.99 2269.07 2822 2018-19 1524.1 646.02 183.4 2353.52 3042 2019-20 1588.78 599.61 186.17 2374.56 3498 2020-21 1610.47 547.21 143.65 2301.33 3203 - First Time Freshman Retention Rates
Retention Rate defined (source IPEDS glossary)
A measure of the rate at which students persist in their educational program at an institution, expressed as a percentage. For four-year institutions, this is the percentage of first-time bachelors (or equivalent) degree-seeking undergraduates from the previous fall who are again enrolled in the current fall. For all other institutions this is the percentage of first-time degree/certificate-seeking students from the previous fall who either re-enrolled or successfully completed their program by the current fall.Fall to fall retention rate of first-time freshman cohort by year of matriculation Full Time Headcount % retained 2016 464 64% 2017 445 69% 2018 501 64% 2019 449 67% 2020 412 74% - Four- and Six-Year Graduation Rates
Graduation Rate defined (source IPEDS glossary)
Data are collected on the number of students entering the institution as full-time, first-time, degree/certificate-seeking undergraduate students in a particular year (cohort), by race/ethnicity and gender; the number completing their program within 150 percent of normal time to completion; the number that transfer to other institutions if transfer is part of the institution’s mission.Graduation rate of first-time freshmen listed by cohort year Full time 4 Year 6 Year 2011 21% 41% 2012 24% 48% 2013 28% 51% 2014 28% 50% 2015 29% 48% - Major Head Counts
Undergraduate MajorsHead Count Majors 2017-18 2018-19 2019-20 2020-21 2021-22 ACC 55 44 22 19 25 ANTH 18 18 17 16 14 ART 98 106 107 85 83 BIOL 241 242 247 218 217 BUAD 384 398 361 323 317 CHEM 30 32 35 31 28 COM 80 67 78 70 75 CS 56 61 67 83 104 ECON 27 41 33 34 20 EDUC 60 57 59 51 49 ENG 57 47 53 42 44 ENVS 142 136 130 111 97 ESS 181 170 148 152 GEOL 55 44 41 33 29 HIST 45 47 41 29 37 MATH 45 50 48 38 30 MUS 18 21 21 18 18 NTR 6 PHYS 2 110 POLS 49 63 65 47 43 PSY 143 150 130 107 130 ROE 136 157 116 97 104 SOC 95 89 84 94 77 SPAN 12 13 11 8 10 UNDCL 121 139 135 - FTE-S Generated by Program Code
Undergraduate FTESFTES 2016-17 2017-18 2018-19 2019-2020 2020-2021 ACC 47.9 49.7 44.63 34.37 28.6 ANTH 38.5 35.8 41.4 34 25.7 ART 101.07 89.83 95.83 92.67 85.47 BIOL 140.4 146.18 143.33 153.7 147.03 BUAD 185.31 187.6 194.63 167.8 171.03 CHEM 73 72.52 63.47 69.33 61.97 COM 116.4 111.13 123.7 135.4 116.3 CS 39.2 31.9 43 51.77 65.37 ECON 64.86 66.63 65.2 64.4 48.63 EDUC 20.6 23.57 20.18 27.9 26.57 ENG 142.07 129.8 144.4 153.03 132.27 ENGR 4.7 12.7 ENVS 63.1 59.31 64.47 64.3 61.7 ESS 119.42 107.73 101.43 83.5 73.13 GEOG 19.56 14.43 19.5 16.5 14.57 GEOL 69.1 55.8 61.61 55.97 44.5 HIST 52.83 53.6 50.87 50.6 56.03 HNRS 14 15.07 14.4 13.5 13.6 HWTR 17.47 17.23 18.87 17.23 15.43 MATH 170.5 145.93 151.17 168.87 188.3 MUS 47.22 52.02 59.55 44.78 37.73 PHIL 23.7 25.6 23.6 25.6 28 PHYS 45.13 44.03 38.57 48.13 56.93 POLS 49.06 52.7 61.67 49.5 51.8 PSY 112.37 111.4 114.33 98 114 ROE 133.68 111.48 116.97 99.4 120.1 SCI 9.6 7.93 8.97 9.2 6.47 SOC 80.47 72.1 76.9 103 94.1 SPAN 12.9 13.4 15.6 10.63 16.8
See more outcome data on the U.S. Department of Education College Scorecard site, or the National Center for Educational Statistics College Navigator page.
Common Data Set
- 2007-2008
- 2008-2009
- 2009-2010
- 2010-2011
- 2011-2012
- 2012-2013
- 2013-2014
- 2014-2015
- 2015-2016
- 2016-2017
- 2017-2018
- 2018-2019
- 2019-2020
- 2020-2021
- 2021-2022
Inclusion
Learning through diverse experiences and perspectives.
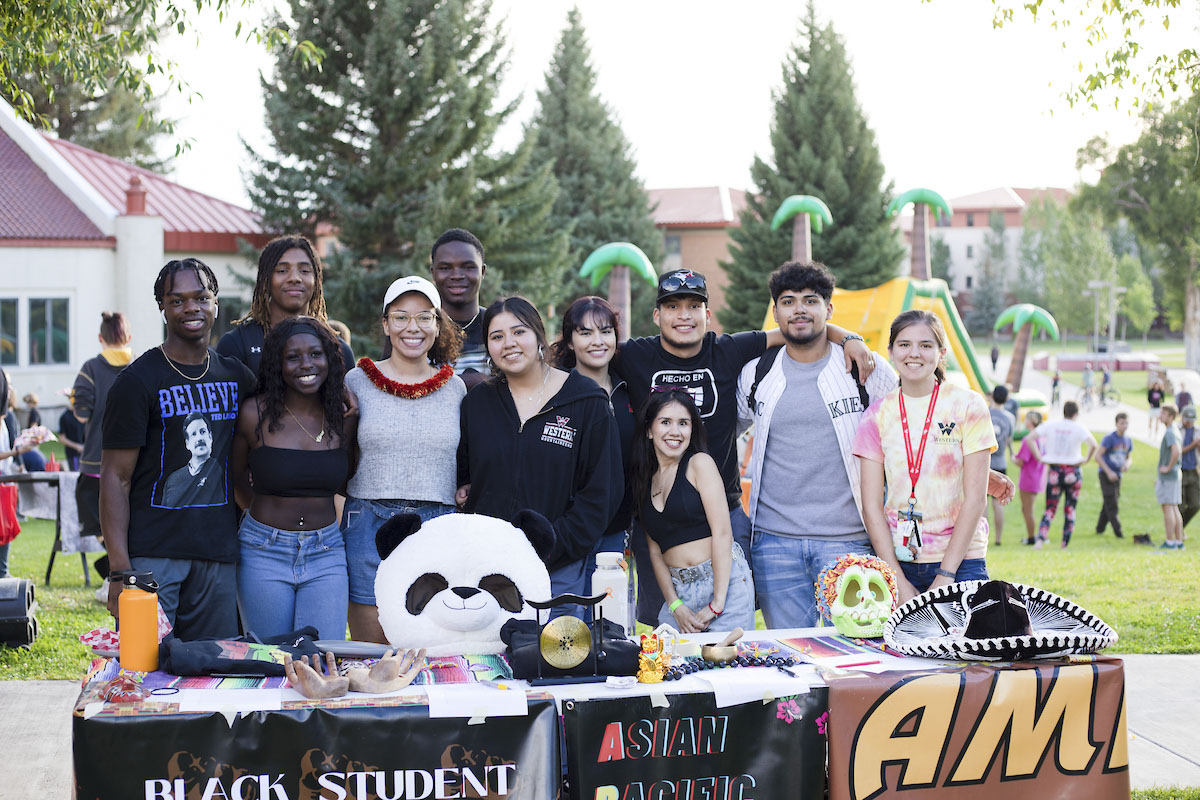
We know people of different backgrounds bring various experiences and perspectives to the classroom and community. Through ongoing education, attention to cultural differences and a focus on social and intellectual growth, we strive to provide a healthy and supportive academic environment for all students, faculty and staff.
A focus on our values
Diversity is a core value at Western Colorado University, as it’s central to education and growth.
Find your voice
At Western, we provide the academic resources and social opportunities to succeed and grow as students and future leaders.
Western’s Statement on Diversity and Inclusion
“Western Colorado University takes a firm and unyielding stance in support of diversity, inclusivity, scientific inquiry and creative expression. We believe these principles are necessary for the free and open inquiry that defines our role as a public institution in a democratic society. We believe that these principles are a moral imperative requiring constant vigilance and a firm stance against actions motivated by hate or intimidation. The university welcomes people of color, people with disabilities, people of all genders and orientations, people of all religious preferences, immigrants and refugees regardless of national origin or ethnicity and other underrepresented communities regardless of socioeconomic class. We actively seek to build a civil and respectful culture which affirms these principles in all that we do.”
The Board of Trustees endorsed the above Statement on Diversity and Inclusion authored and adopted by the Faculty Senate.